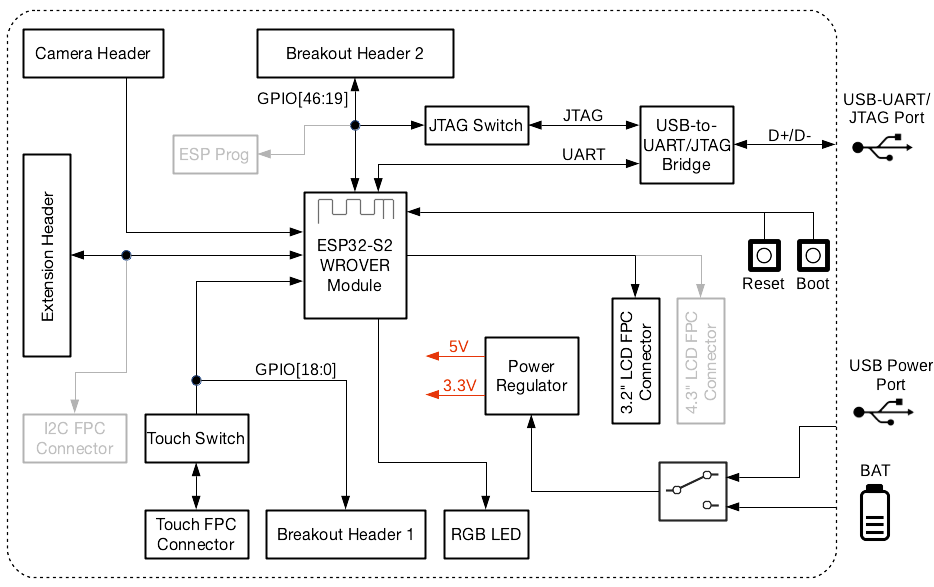
ESP32 S2 Kaluga does not connect to debugger
Posted: Thu Sep 30, 2021 10:09 pm
Hello,
I am using ESP32 S2 Kaluga-1 dev kit and I am trying to get the debugger working . But When I run the Open OCD I see the error below
I tried both in MAC and Windows . I am using Windows 10 and MAC Bigsur.
I tried to replace the FTDI driver with Windows using Zadig on Windows . Still I dont see any changes. I am stuck . Any help appreciated .
Thanks
I am using ESP32 S2 Kaluga-1 dev kit and I am trying to get the debugger working . But When I run the Open OCD I see the error below
Code: Select all
Info : Listening on port 6666 for tcl connections
Info : Listening on port 4444 for telnet connections
Info : ftdi: if you experience problems at higher adapter clocks, try the command "ftdi_tdo_sample_edge falling"
Info : clock speed 20000 kHz
Error: JTAG scan chain interrogation failed: all ones
Error: Check JTAG interface, timings, target power, etc.
Error: Trying to use configured scan chain anyway...
Error: esp32s2.cpu: IR capture error; saw 0x1f not 0x01
Warn : Bypassing JTAG setup events due to errors
Info : Listening on port 3333 for gdb connections
I tried to replace the FTDI driver with Windows using Zadig on Windows . Still I dont see any changes. I am stuck . Any help appreciated .
Thanks
